Vermont Cardiac Deaths
(Sarcasm is OFF for this post.)
In an earlier post, I described a procedure for importing Vermont death certificate data into a MySQL database. In a subsequent post, I looked at Covid-related deaths. Now let’s look at cardiac-related deaths:
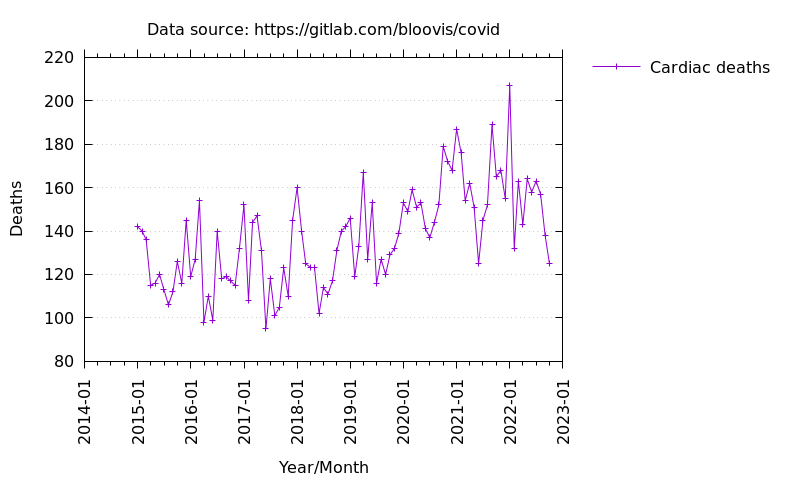
(Bear in mind that this graph includes all causes of death (Cause A/B/C/D plus Other Contributing Conditions) that contain the string “cardi”.)
There are some interesting things to note about this graph. First, there seemed to be a dramatic increase in cardiac deaths starting in the last quarter of 2020, before the mRNA shots were available. Things settled down a bit in the summer of 2021, but then spiked up again in the fall and winter, and still haven’t come down to the pre-2020 levels.
It’s not easy to draw any definite conclusions from this. But let’s say that the standard narrative is true, and that Covid caused cardiac deaths in 2020, and that the spike at the end of the year was an expected seasonal effect. In that case, we would expect some kind of “dry tinder” effect, where vulnerable people (largely elderly and/or ill) were culled by the disease in 2020. Additionally, the standard narrative told us that the introduction of mRNA jabs at the end of 2020 was expected to stop serious illness. So things should have looked better in following years.
But instead, cardiac deaths showed a rising trend after 2020 (with a summer lull in 2021), and even spiked to new heights at the end of 2021. So something happened in 2021 and 2022 that kept cardiac deaths from returning to the lower levels of years prior to 2020. What could that “something” possibly be?
(Alert readers may notice that there is a sudden drop in October 2022. This is likely due to the fact that the death certificate data only go up to October 26, 2022, and that there is a delay between death and recording.)