Vermont Covid Deaths
(Sarcasm is OFF for this post.)
In an earlier post, I described a procedure for importing Vermont death certificate data into a MySQL database. Now we can query this database to look at causes of death in Vermont in recent years.
For a first example, let’s look at “Covid deaths”: specifically, Covid-related deaths (either “from” or “with”) on a month-by-month basis. I’ve described how to do this in my Gitlab repository; scroll down in the README to the section titled “Plotting Covid deaths by month”. I won’t repeat the procedure here, but let’s look at the resulting plot:
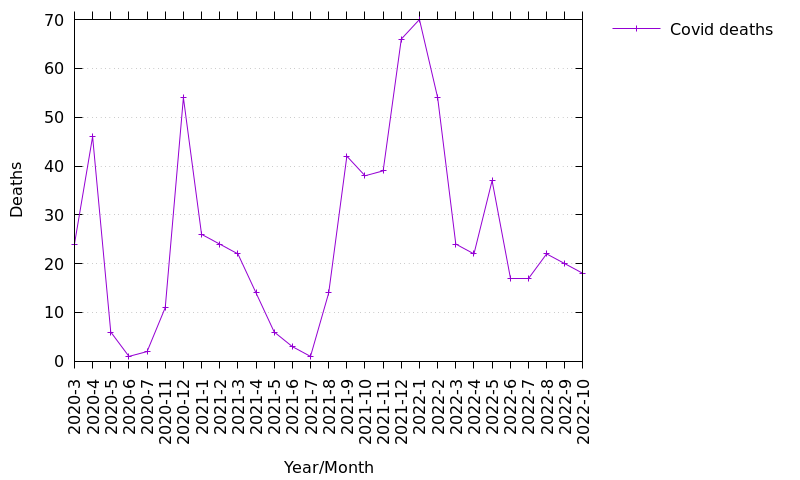
(Bear in mind that this graph includes all causes of death (Cause A/B/C/D plus Other Contributing Conditions) that mention the word “covid”. To get the the actual deaths due entirely to Covid, we would need to search only Cause A; we’ll look at that in a subsequent post.)
In looking at the graph, we can see the expected winter peaks that are typical of respiratory infections. But the peak in the winter of 2021-2022 is noticeably higher than the peak the year before, in the winter of 2020-2021. This is surprising given that the earlier peak occurred in the days before the Covid mRNA shots were widely available. By the time the next peak had occurred, Vermont had the highest uptake of the Covid shots of any state, around 90% of the adult population. Why was this second peak so much higher?
The second thing to note is that the second winter peak started much earlier, in August, at the height of summer, when respiratory infections are usually very low. In fact, we can see that in 2020, before the shots were available, there were no Covid deaths in the months August through October. So why were deaths so much higher in 2021, when the shots had been administered to so many Vermonters?
The third thing to note is that deaths in 2022 still remained at an elevated level, never coming close to the lows in both 2020 and 2021. This is surprising, given that:
- Viral outbreaks tend to get milder after two years.
- Covid shot uptake was very high by then.
- Respiratory infections are usually very low in the summer.
There are several possible explanations for these surprising results. I believe there is one very likely explanation: one that cannot be uttered in the mainstream media, but which is obvious enough that it hardly needs to be mentioned here.